
Interactive JavaScript Maps Integration with
SharePoint 2013 using Script Editor Web Part
4 March 2015

I have a top level SharePoint site called “Our Offices” and sub site for each country office location (e.g. London, Berlin etc.). The “Our Offices” site home page needs to provide easy navigation to all offices sub sites. Also, I wanted to show where this office location reside on the world map and when someone click on the location, system should redirect the user to that location site home page.
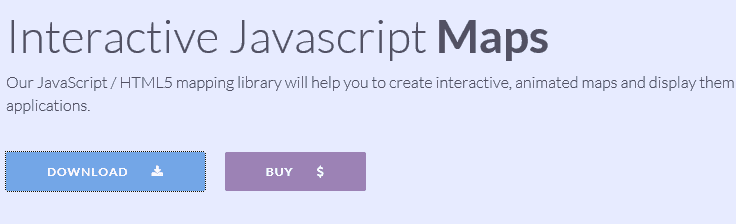
To do this I have used AmMap solution. The JavaScript / HTML5 mapping library (jsmap) help to create interactive, animated maps and display them in your web sites or web applications.
Navigate to http://www.amcharts.com/javascript-maps/ and click on download button.
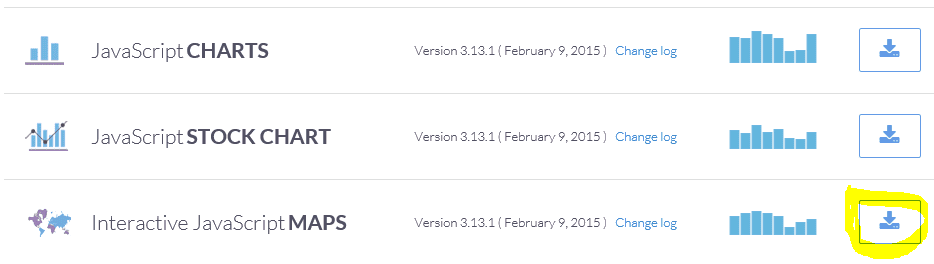
On the next page, click “Interactive JavaScript Maps” download link as highlighted below.
Once downloaded, extract the zip folder and give the root folder a proper name. (By default it will be something like “ammap_3.13.1.free”. I have renamed the root folder to “CoolMaps”)
Copy the “CoolMaps” folder, Navigate to SharePoint 15 hive Layouts folder (C:\Program Files\Common Files\microsoft shared\Web Server Extensions\15\TEMPLATE\LAYOUTS) and past the “CoolMaps” folder here.
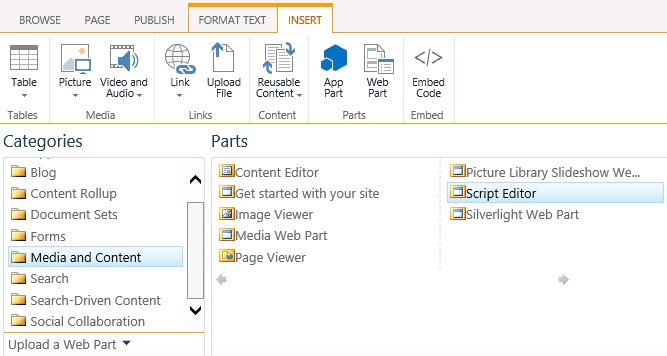
Add “Script Editor” web part on “Our Offices” site home page.
Copy and paste the following code into your script editor web part.
Note: Please updated the locations and SharePoint sub site URLs as per your business requirements.
<link rel=”stylesheet” href=”/_layouts/15/CoolMaps/ammap/ammap.css” type=”text/css”>
<script src=”/_layouts/15/CoolMaps/ammap/ammap.js” type=”text/javascript”></script>
<!– map file should be included after ammap.js –>
<script src=”/_layouts/15/CoolMaps/ammap/maps/js/worldLow.js” type=”text/javascript”></script>
<script type=”text/javascript”>
var map;
// svg path for target icon
var targetSVG = “M9,0C4.029,0,0,4.029,0,9s4.029,9,9,9s9-4.029,9-9S13.971,0,9,0z M9,15.93 c-3.83,0-6.93-3.1-6.93-
6.93S5.17,2.07,9,2.07s6.93,3.1,6.93,6.93S12.83,15.93,9,15.93 M12.5,9c0,1.933-1.567,3.5
3.5,3.5S5.5,10.933,5.5,9S7.067,5.5,9,5.5 S12.5,7.067,12.5,9z”;
AmCharts.ready(function ( ) {
map = new AmCharts.AmMap( );
map.pathToImages = “/_layouts/15/CoolMaps/ammap/images/”;
map.imagesSettings = {
rollOverColor: “#FFA02F”,
rollOverScale: 3, selectedScale: 3,
selectedColor: “#FE5815”,
color: “#FE5815”
};
var dataProvider = {
mapVar: AmCharts.maps.worldLow,
images: [
{svgPath:targetSVG, zoomLevel:5, scale:1.0, title:”London”, latitude:51.5002, longitude:-0.1262, url: “../London”},
{svgPath:targetSVG, zoomLevel:5, scale:1.0, title:”Paris”, latitude:48.8567, longitude:2.3510, url: “../Paris”},
{svgPath:targetSVG, zoomLevel:5, scale:1.0, title:”Berlin”, latitude:52.5235, longitude:13.4115, url: “../Berlin”},
{svgPath:targetSVG, zoomLevel:5, scale:0.5, title:”Amsterdam”, latitude:52.3738, longitude:4.8910, url: “../Amsterdam”},
{svgPath:targetSVG, zoomLevel:5, scale:1.0, title:”Singapore”, latitude:1.2894, longitude:103.8500, url: “../Singapore”},
{svgPath:targetSVG, zoomLevel:5, scale:1.0, title:”Islamabad”, latitude:33.6751, longitude:73.0946, url: “../Islamabad”},
{svgPath:targetSVG, zoomLevel:5, scale:1.0, title:”Beijing”, latitude:39.904030, longitude:116.40752599, url: “../Beijing”},
{svgPath:targetSVG, zoomLevel:5, scale:1.0, title:”Tokyo”, latitude:35.6785, longitude:139.6823, url: “../Tokyo”},
{svgPath:targetSVG, zoomLevel:5, scale:1.0, title:”Chicago”, latitude:41.87811360, longitude:-87.6297981999, url: “../Chicago”},
{svgPath:targetSVG, zoomLevel:5, scale:1.0, title:”Bucharest”, latitude:44.4479, longitude:26.0979, url: “../Bucharest”},
{svgPath:targetSVG, zoomLevel:5, scale:1.0, title:”Moscow”, latitude:55.7558, longitude:37.6176, url: “../Moscow”},
{svgPath:targetSVG, zoomLevel:5, scale:1.0, title:”San Marino”, latitude:43.9424, longitude:12.4578, url: “../SanMarino”}
]
};
map.dataProvider = dataProvider;
map.objectList = new AmCharts.ObjectList(“listdiv”);
map.showImagesInList = true;
map.write(“mapdiv”);
});
</script>
<div>
<div id=”listdiv” style=”width:200px; overflow:auto; height:500px; float:right; background-color:#FFFFFF;”></div>
<div id=”mapdiv” style=”margin-right:200px; background-color:#FFFFFF; height: 500px;”></div>
</div>
<br/>
Save the page and publish it.
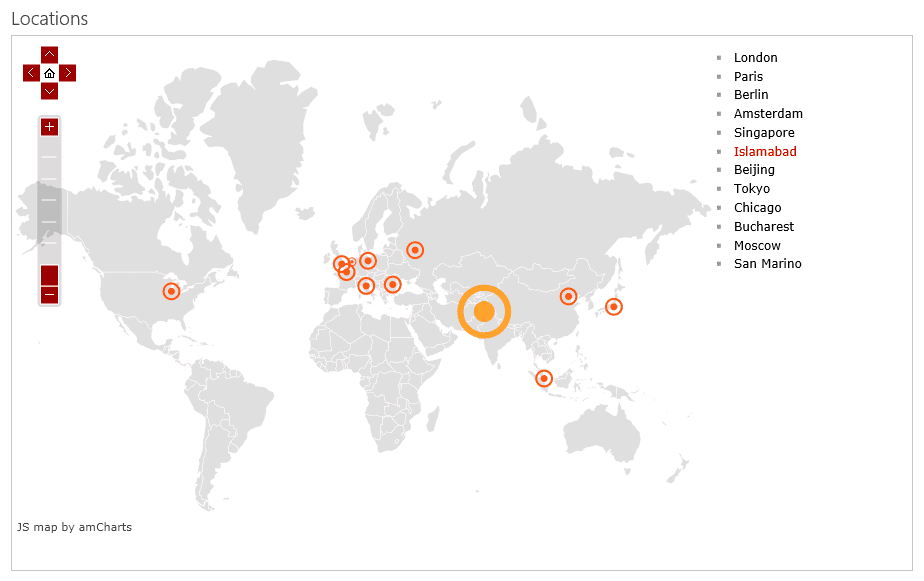
The Map should appear like this on the page
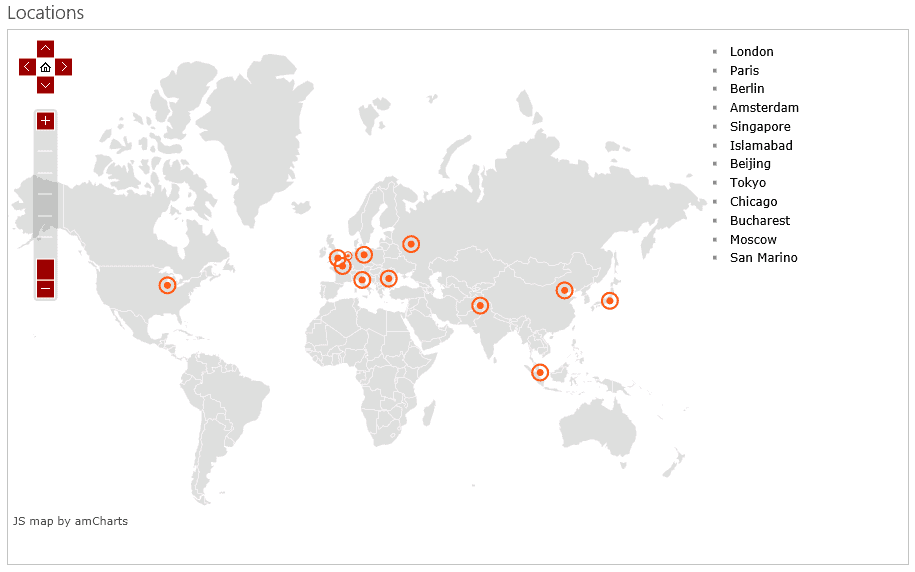
On mouse hover it will highlight the location on the map and when user click on a location, it will take you to pre-configured sub site for that location.
The map I am showing here is just for demo purpose. There are many more types of maps available in this library. Go and explore the rest